

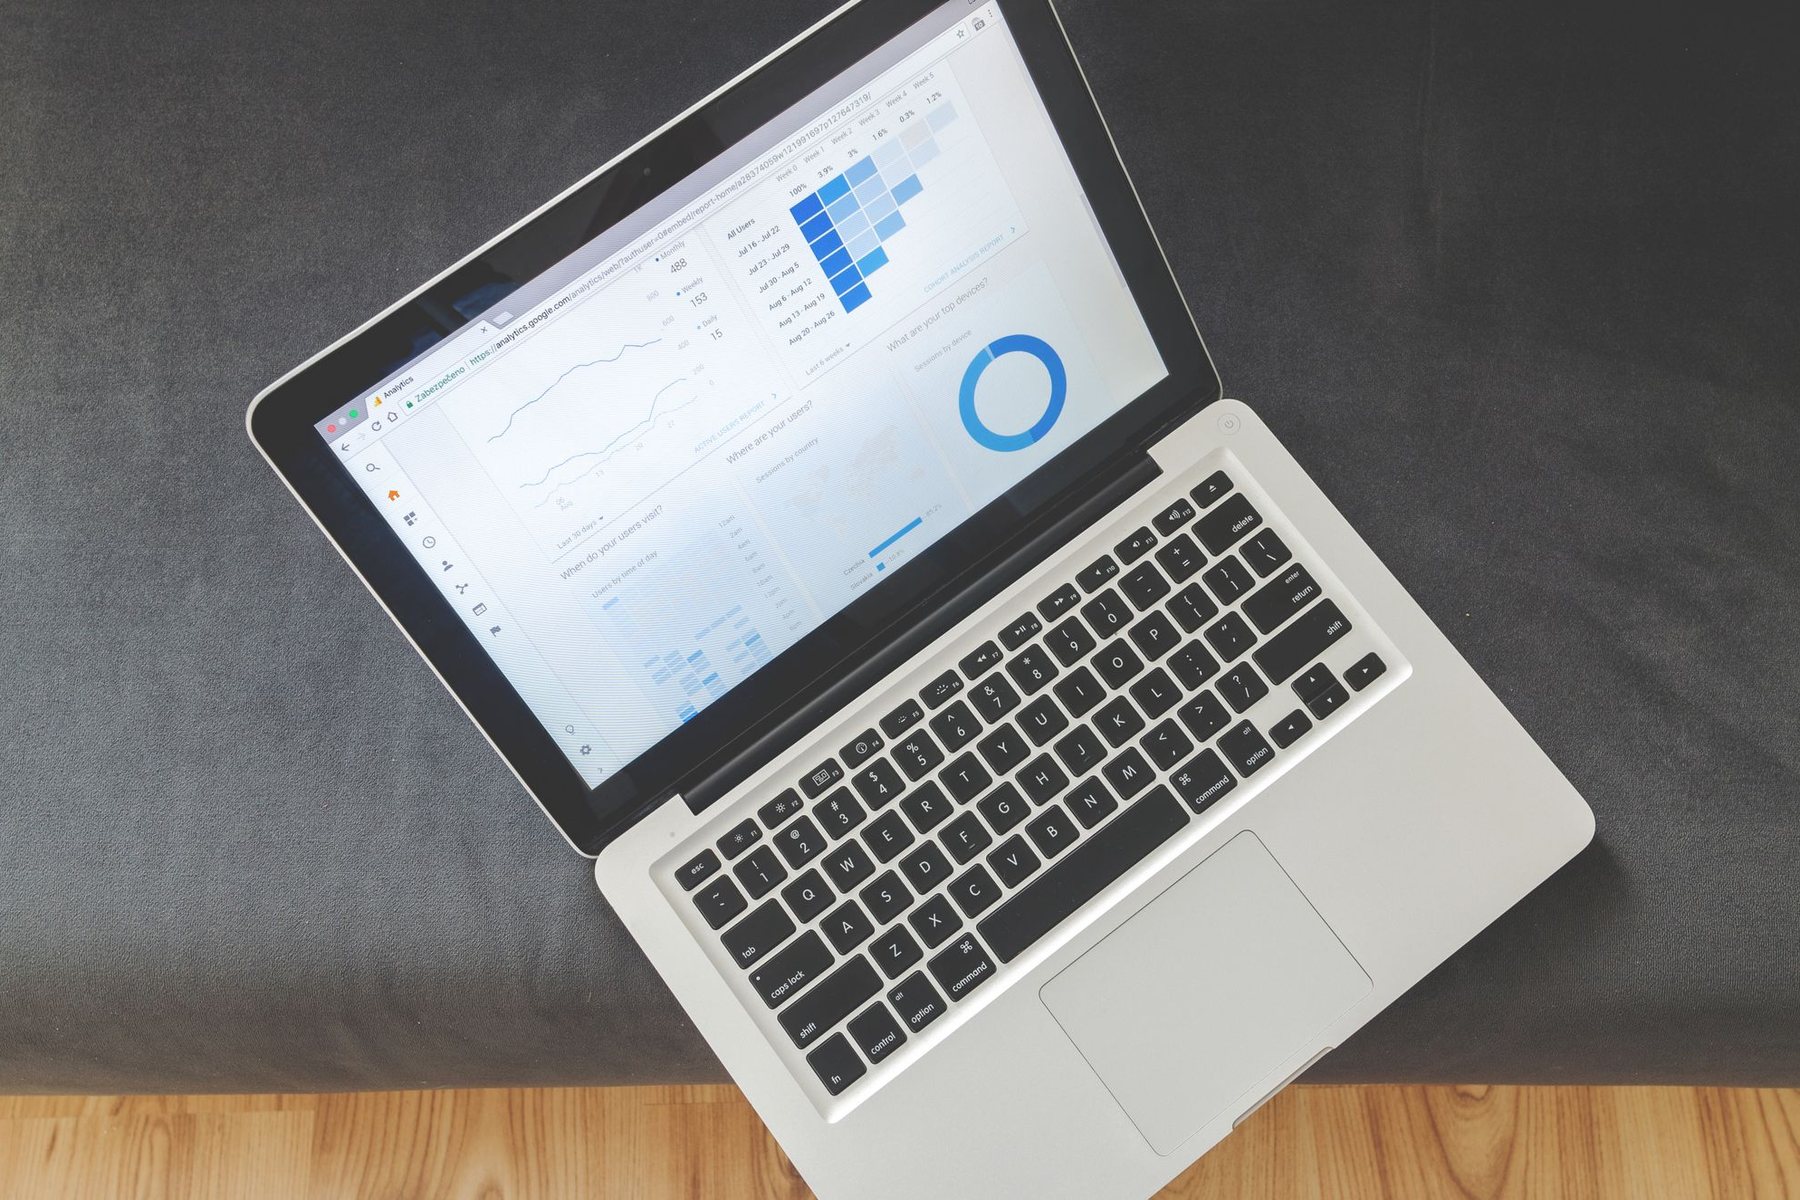
In many businesses, someone spends part of every Monday exporting CSVs from three tools, pasting them into a spreadsheet and emailing a report that is out of date by Wednesday. Automated reporting replaces that ritual with dashboards that pull data directly from your systems and update on their own. The benefit is not only time saved; it is that decisions are made on current numbers, and everyone looks at the same figures.
This guide covers how to make the switch without ending up with a dashboard nobody opens.
Why manual reports fail quietly
Manual reports are fragile in ways that are hard to see:
- Copy-paste errors go unnoticed because nobody rechecks the source.
- Definitions drift. One person counts “revenue” as invoiced, another as received.
- The report depends on one person. When they are on holiday, it does not get done.
- It is always backward-looking. By the time the report arrives, the week is over.
None of these are solved by a nicer spreadsheet template. They are solved by connecting reports directly to the data.
Decide what the dashboard is for
Before touching any tool, answer three questions for each report you produce today:
- Who reads it? Founders, sales, operations and finance need different views.
- What decision does it support? If nobody changes anything based on a metric, it does not belong on the main dashboard.
- How fresh does it need to be? Daily updates are enough for most business metrics. Real-time data adds complexity and is rarely needed outside operations or support queues.
Write a one-line definition for every metric, including where the data comes from and how it is calculated. This “metric dictionary” prevents most arguments later.
Getting the data in one place
| Approach | How it works | Good fit for |
|---|---|---|
| Native connectors | Dashboard tool connects directly to each app | Few sources, standard metrics |
| Spreadsheet as a hub | Automations push data into a shared sheet that feeds charts | Small teams, simple needs |
| Central database or warehouse | Scheduled jobs copy data from each tool into one database | Many sources, combined metrics, history |
| Built-in app reporting | Use each tool’s own reports | One main system of record |
Combining data across tools, for example marketing spend from ad platforms with closed revenue from your CRM, is where most of the value lies, and also where the work is. A central database makes this far easier because you can join tables and keep history even if a source tool only exposes recent data.
Choosing a dashboard tool
Options range from free tools such as Looker Studio, through business intelligence products like Power BI and Metabase, to dashboards built into a custom internal app. Consider:
- Connectors for the tools you already use.
- Who will edit dashboards. Some tools are friendly for non-technical users; others assume SQL knowledge.
- Access control, especially if you share dashboards with clients or partners.
- Ownership of data. If you might switch tools later, keeping data in your own database makes that easier.
If your reporting is part of a product your customers use, a custom dashboard inside the application is often the better route. Our guide on choosing a tech stack for a SaaS MVP covers how that fits into a wider build.
Rolling out automated reporting step by step
- Pick the single report that takes the most manual effort and rebuild it first.
- Run the old and new reports side by side for a few cycles and reconcile any differences.
- Retire the manual version once numbers match and people trust the dashboard.
- Add a scheduled email or chat summary with a link, so the dashboard comes to people instead of waiting for them to visit.
- Set alerts for meaningful thresholds, such as a sudden drop in leads or a spike in support tickets.
Protecting sensitive figures
Once reports are live and easy to share, access needs more thought than it did with an emailed spreadsheet. Decide who should see revenue, salaries, margins and customer-level data, and set permissions by role rather than sharing public links. If dashboards include personal data, such as named customers or employee performance, check that this fits your privacy obligations and keep only what you need. Give read-only access by default, and limit editing rights to the people responsible for accuracy so a well-meaning change does not quietly break a calculation.
Traps to avoid
- Too many charts. A dashboard with forty widgets answers no question clearly. Start with a small set of headline numbers and add detail pages behind them.
- Silent data failures. If a connector breaks, the dashboard may show flat lines that look like a bad week. Display a “last updated” time and alert someone when a sync fails.
- Vanity metrics. Followers and page views look good but rarely drive decisions on their own.
- No owner. Every dashboard needs someone responsible for its accuracy.
Turning reports into action
The real goal is to shorten the time between something happening and someone responding. Pair dashboards with simple automations: when a metric crosses a threshold, create a task or notify the owner. That turns reporting from a weekly review into an early warning system. For more candidates beyond reporting, see our list of business processes you can automate.
Let us connect your numbers
SiteWright Technologies builds data pipelines and dashboards that pull from your CRM, accounting, e-commerce and marketing tools, with monitoring so the figures stay trustworthy. Explore our automation solutions or reach out to discuss which reports you want off your plate.